

Excel University’s Top 5 Power Query Tutorials

Power Query might just be one of the coolest tools available in Excel. It’s a data retrieval and transformation tool that extracts information from a variety of sources, including CSV files, Excel files, directories, databases, and more. Once you’ve connected to a data source, you can use various transformations to help clean and prepare the data for use. Removing unneeded columns or rows, separating columns, and unpivoting data are all examples of those transformations.
Most would consider Power Query an advanced Excel function, but the neat thing is that it has a much less significant learning curve than something like learning VBA (or even some of the more advanced functions).
An Excel University student was even able to use Power Query as part of an Excel project that completely eliminated his company’s need for specialized budgeting software!
To help you get familiar with this incredibly useful Excel tool, we’re rounding up some of our most popular Power Query tutorials to date.
1. Power and Pivot
You may have heard of the terms “Power BI,” “Power Query,” and “Power Pivot,” but don’t know what they mean. If so, this post is the intro you need! It walks you through the differences between the tools and how to use them.
Excel is used for a variety of purposes, including data analysis, journal entry calculations, and task tracking, but there’s one particularly popular use for Excel: creating reports. It’s especially popular to export data from one system, and then summarize it in Excel. It’s common to offer the summary data as a report with a table of numbers or a graph.
Essentially, these tools optimize and automate that process, from importing the source data to producing the final report. Even better, after you’ve created the report, you can renew it with a single click the following month, and every month after that!
2. Create Dynamic Rows for an Amortization Schedule with Power Query
Sometimes, you’ll want to use formulas in Excel to compute row values – however, you might have a report where the number of rows is dynamic and varies on a regular basis. For example, let’s say you want to create a debt payment plan that can be applied to a range of loans.
Typically, debt will have different payoff periods, so you’ll need the number of rows to reflect the different number of months for each period (36 months, 120 months, 360 months, etc.).
One common workaround is creating a bunch of extra rows just in case you need them, but that’s not the most organized way of viewing your data. This post will teach you how to use Power Query to keep your rows dynamic and easy to read!!
3. Excel for Budgeting
Excel University student Moss watched one of our webinars that gave a rundown of Power Query and how to use it in a company’s annual budget. While he wasn’t initially familiar with the tool, he was able to learn more about it and ended up completely changing the way his company performs its budgeting process!
His company was able to completely eliminate the need for the budgeting software they were using by creating an easy-to-read Excel report instead. In this post, Moss gives a step-by-step guide on how he was able to do it!
4. Power Query Calendar
Numeric values are generally supported by PivotTable value fields; however, text values – like Birthday Party or Filing Date – are not. Fortunately, Power Query can help you work around that and label your calendar exactly how you need it! This post teaches you step-by-step how to accomplish it.
Even if you don’t typically use Excel to keep track of your important dates, this walkthrough includes some cool transformations that can be used in plenty of other scenarios.
5. Slow to Fast 3
Our Slow to Fast series is all about steadily improving the efficiency of comparing two lists (also called reconciliation). Slow to Fast 1 discusses conditional formatting and how it can help us differentiate information between lists. Slow to Fast 2 incorporates the lookup functions which are useful when the lists are larger, spread across multiple sheets, or when more than one column needs to be considered.
Slow to Fast 3 is the last post in the series, and it teaches you how to use Power Query to save even more time if you perform similar reconciliations on a regular basis!
Isn’t Power Query amazing? As with everything in Excel, we’re always learning new ways to incorporate it into our reports and save ourselves some precious time. Even if you’re a little unfamiliar with it, these posts will give you a solid foundation and great hands-on practice that can help you use the tool for your own Excel reports in the future.
Do you have any other neat tips for using Power Query? Let us know in the comments!
Share This Article
What's Trending?
Trending topics & tools for the CPA community

Announcing Business Valuation: Fundamentals, Techniques, and Theory
Written by leading industry experts, this book is an authoritative and comprehensive how-to guide to valuing private business enterprises.
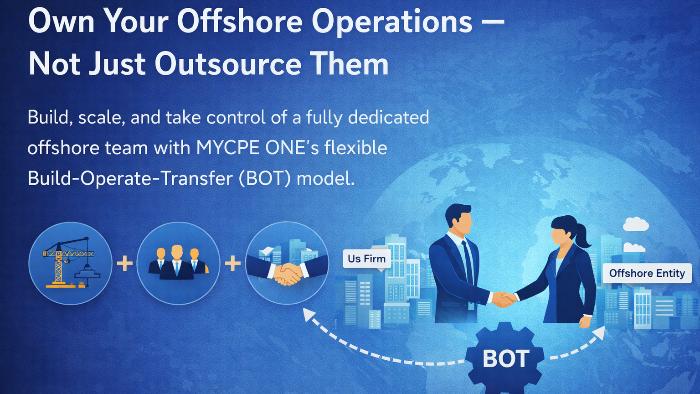
Own Your Offshore Operations — Not Just Outsource Them
Build, scale, and take control of a fully dedicated offshore team with MYCPE ONE’s flexible Build-Operate-Transfer (BOT) model.

How Firms are Rethinking Reasonable Comp (Quick Video)
It’s a short video and makes the value of repeatable, data-backed approach clear (especially compared to spreadsheets, gut checks and one-off calculations).
Resources
Valuable information provided by our sponsors.
Effective, Hands-On Training That Fits Your Schedule and Your Budget
Save your seat in Becker’s new Open Enrollment Staff Level Training (SLT) and take part in expert-led tax...
Provided By:
CPAdirectory members have access to discounted auto and home insurance
At CPAdirectory, we think it's a good thing to provide our members with access to...
Provided By:
The accounting firms growing fastest all have this in common
Discover the billing and cash flow strategies helping firms get paid faster and grow smarter.
Provided By:
Stop Tool-Hopping: See what's new at Canopy (Plus $75)
Canopy has released massive updates to give you a truly all-in-one experience and consolidate your...
Provided By:
Free CPE-eligible Webinar: Lead Your Clients to a Successful Business
Free CPE for CPAs: Learn how to transform financial data into actionable guidance, deepen client...
Provided By:
The Bookkeeping Brand That Was Actually Built for Accountants
The BooXkeeping franchise opportunity provides everything you need to start, run, and grow a successful...
Provided By: